
Preview: 3 of 18 pages. Scroll sideways to see more.
$3.50
In your cart. View cart
No account needed. You get a download link.
| Grade | 6th Grade to 8th Grade |
|---|---|
| Resource type | Projects |
| Subject | Math |
| Format | PDF, 18 pages |
| How was this made? | Created by hand, with images from generation tools |
| Updated | 2026-10-26 |
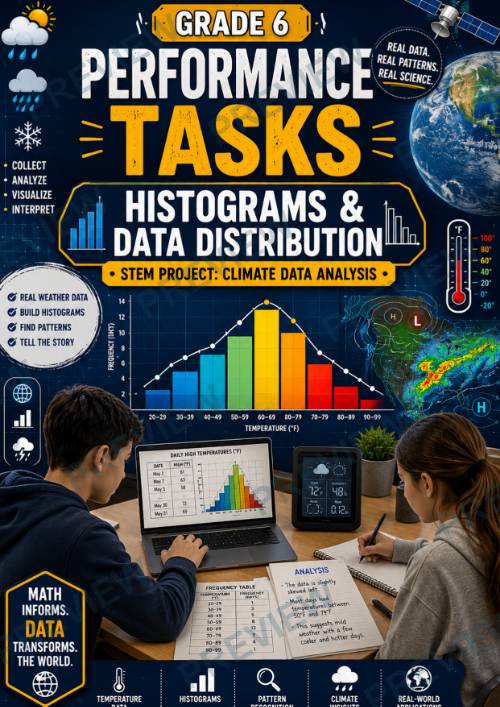
Grade 6 Histograms & Data Distribution Performance Task -STEM
Grade 6 Performance Tasks: Histograms & Data Distribution
STEM Project: Climate Data Analysis
Bring statistics to life through real-world climate science! In this engaging Grade 6 Math Performance Task, students become climate data scientists as they collect, organize, graph, and interpret real weather and climate data using histograms.
Students analyze patterns in temperature, rainfall, snowfall, or wind-speed data while learning how mathematicians, meteorologists, and scientists use data distributions to identify trends and make predictions about the world around us.
This highly visual STEM project combines:
- statistics
- graphing
- data interpretation
- scientific inquiry
- real-world applications
into a rigorous and engaging performance-based learning experience.
Perfect For
- Statistics Units
- Histograms & Data Distribution
- STEM Math Projects
- Climate Science Connections
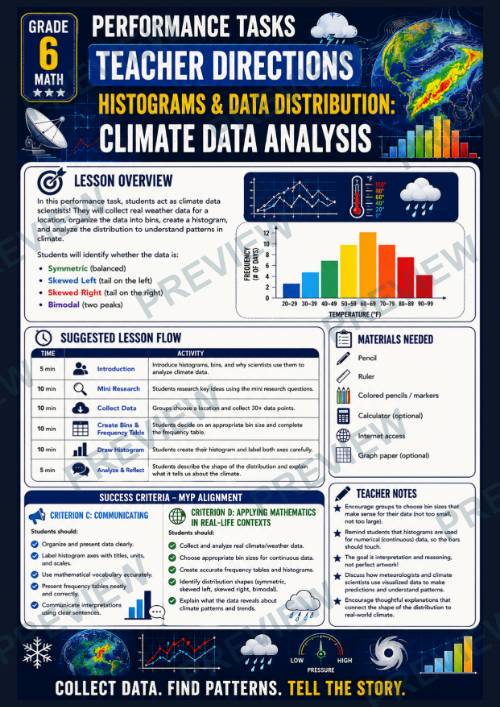
- MYP Math Criterion C & D
- Project-Based Learning (PBL)
- Inquiry-Based Learning
- Performance Tasks
- Math Centers
- Sub Plans
- Collaborative Group Work
What's Included:
✔ Teacher Directions & Lesson Flow
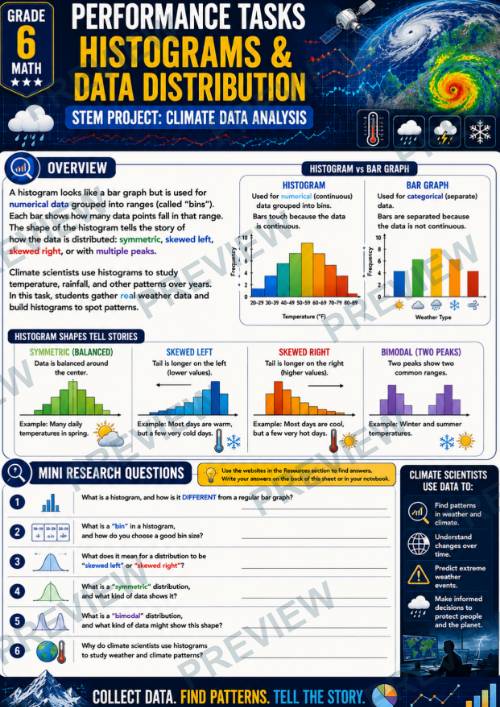
✔ Overview & Mini Research Questions
✔ Online Resources Page (Color + B/W)
✔ 5-Step Group Activity Directions (Color + B/W)
✔ 2 Student Planning Pages (Color + B/W)
✔ Full-Page Histogram Template (Color + B/W)
✔ MYP Math Rubric (Color + B/W)
✔ Print-Friendly Black & White Versions Throughout
Students Will:
- Collect and organize real climate data
- Create frequency tables
- Choose appropriate bin sizes
- Construct histograms correctly
- Analyze data distributions
- Identify symmetric, skewed, and bimodal patterns
- Interpret climate trends using data
- Communicate mathematical thinking clearly
- Apply mathematics to real-world scientific contexts
Math Skills Covered
- Histograms
- Frequency tables
- Data distributions
- Bin/class intervals
- Statistical interpretation
- Graphing
- Data analysis
- Mathematical communication
- Real-world statistics applications
STEM & Science Connections
Students explore:
- Climate science
- Weather patterns
- Meteorology
- Environmental data analysis
- Scientific modeling
- Data visualization
- Research & observation skills
Why Teachers Love It
- Strong real-world relevance
- High student engagement
- Beautiful visual organization
- Ready-to-print format
- Scaffolded for multiple ability levels
- Encourages critical thinking and collaboration
- Includes both color and black-and-white versions
- Supports inquiry and STEM integration
IB / MYP Disclaimer
This product is an independent educational resource and is not affiliated with, endorsed by, sponsored by, or approved by the International Baccalaureate Organization (IBO). References to MYP Criteria are included solely to support teachers using an inquiry- and criteria-based instructional framework.
·
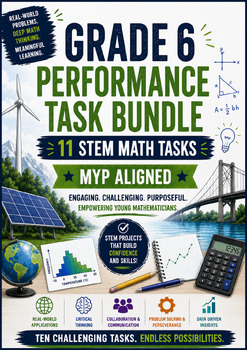
This resource is also part of a bundle with 10 other resources
Questions
No questions yet.
Ask a question
Your question goes to No Prep Plans. Answers show on this page, without your name or email.
Sent. The answer will show on this page.
Reviews
No reviews yet. Buyers can review a resource from their order page.
More from No Prep Plans
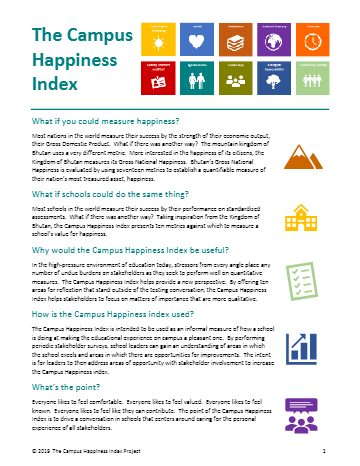
Campus Happiness Index
 No Prep Plans
$3.00
Book Labels
No Prep PlansFree

Big Band & Jazz Musicians Poster Set (1930s–1950s)
No Prep Plans$3.50
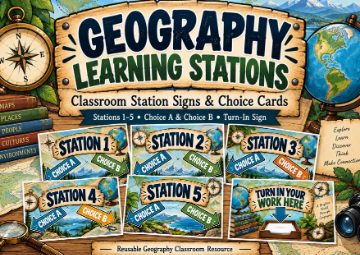
FREE Geography Learning Stations Signs & Choice Cards--Reusable
No Prep PlansFree
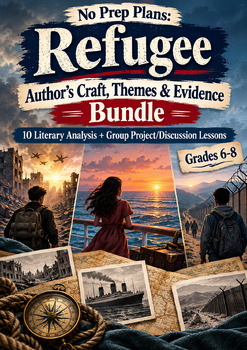
Refugee: Author's Craft, Themes & Evidence Bundle 10 Literary Analysis Lessons
No Prep Plans$29.25
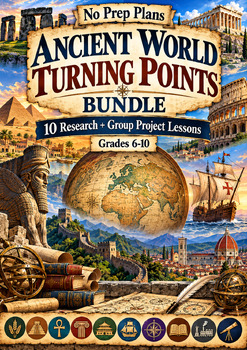
Ancient World Turning Points Bundle | 10 Research + Group Project Lessons | 6-10
No Prep Plans$29.25
Request a quote or purchase order
For schools and districts. Your request goes to No Prep Plans, who will reply to your email with a quote or invoice.
Sent. The seller will reply to your email.
Report this listing
What your notice must include
The address of the listing on Classroom Clearinghouse (for example, the /p/ link).
https://classroomclearinghouse.com/p/hcmpwy6fus
Your name, mailing address, phone number, and email.
How to report
Your name, company, mailing address, phone number, and email.
The address of each listing or store you are reporting.
https://classroomclearinghouse.com/p/hcmpwy6fus
Copyright owners can also use the DMCA notice page.
Thanks. The report is in the review queue.